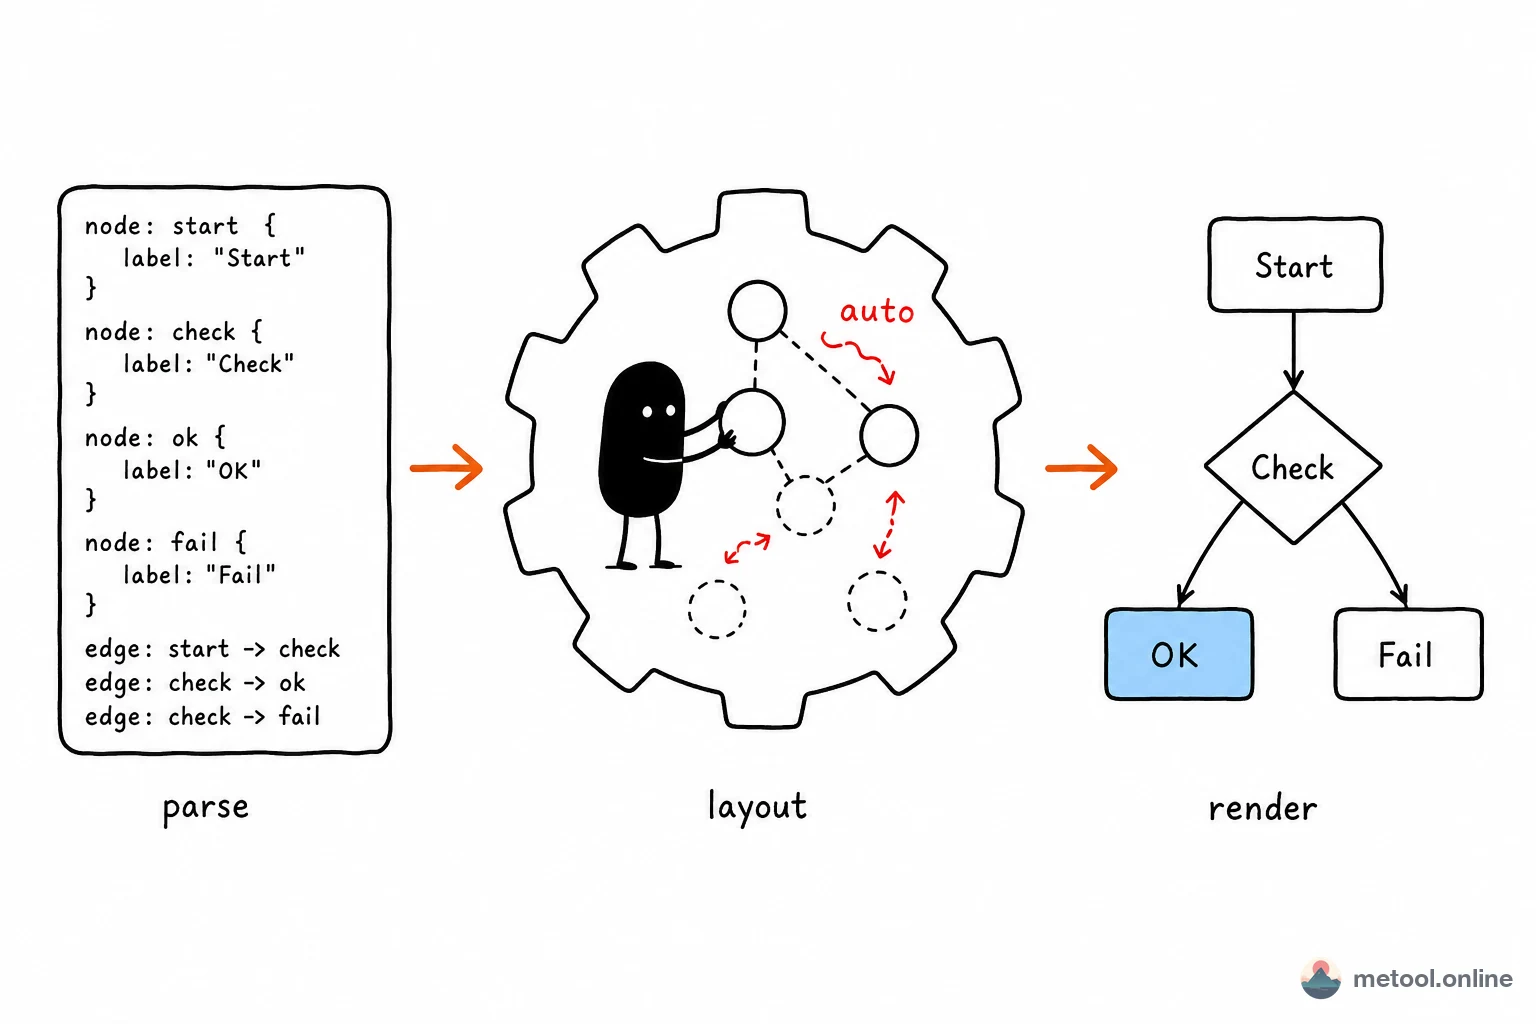
"Describe in text, get a diagram" sounds like magic, but it is a clear three-stage pipeline: parse text into an abstract structure, compute each element's position with algorithms, render vector graphics. Understanding those stages tells you what these systems can and cannot do.
What Is Diagram-as-Code?
Diagram-as-code means describing a diagram's logical structure in plain text and letting a program generate the graphic—Mermaid, PlantUML, Graphviz/DOT, D2, and similar. The author declares which nodes exist and how they connect; coordinates are not specified manually.
That contrasts with draw.io, Visio, and other manual tools, where you place every box, size, and bend. In diagram-as-code, algorithms handle placement. That single difference drives all downstream trade-offs—control, maintainability, and fit for purpose.
What Steps Turn Text into a Diagram?
Almost every engine follows the same three-stage pipeline:
- Parse: turn domain-specific language (DSL) text into an AST / internal graph model—node set, edge set, attributes (labels, shapes, direction).
- Layout: the hard part. Algorithms compute node coordinates and edge routes from topology—minimize crossings, align rows/columns, keep spacing readable.
- Render: draw the geometry as SVG / Canvas with theme styles, fonts, and colors.
| Stage | Input | Output | Main difficulty |
|---|---|---|---|
| Parse | DSL text | Graph model (nodes/edges/attrs) | Syntax ambiguity, error location |
| Layout | Graph model | Geometry with coordinates | Crossings, alignment |
| Render | Geometry + style | SVG / bitmap | Font metrics, theme consistency |
Of the three, layout is what turns "logic" into a readable picture—and where engines diverge most.
How Is Automatic Layout Computed?
Layout is an optimization problem: place nodes and route edges in 2D for maximum readability (fewest crossings, clearest hierarchy, even spacing). Different graph types use different algorithm families:
- DAGs / layered graphs (flowcharts, dependency graphs): often Sugiyama layered layout—assign ranks, order within layers to minimize edge crossings, then assign coordinates. Graphviz
dotand front-enddagrebelong here. - General relational / network graphs: often force-directed layout—edges as springs, nodes as repelling particles, iterate to a low-energy stable state.
- Sequence diagrams, Gantt charts: little complex optimization needed—time axis or participants impose strong constraints; layout is nearly deterministic.
A commonly misunderstood property: layout is computed at render time, not stored as fixed coordinates. Engine or layout library upgrades can change placement for the same source—that is inherent, not a defect.
How Do Major Engines Compare?
Same paradigm, different design goals:
| Engine | Runtime | Strengths | Trade-offs |
|---|---|---|---|
| Graphviz (DOT) | Native / WASM | Large graphs, mature layered algorithms | Low-level syntax, plain styling |
| Mermaid | Browser JS | Many diagram types, Markdown ecosystem | Limited control on complex large graphs |
| PlantUML | JVM | Full UML (class, sequence, component) | Requires Java runtime |
| D2 | Native | Modern syntax, pluggable layout engines | Newer ecosystem |
No single "best": formal UML with JVM acceptable → PlantUML has broadest coverage; lightweight embed in web/Markdown → Mermaid has lowest integration cost; huge dependency graphs → Graphviz layered algorithms scale best.
Capability Boundaries and Known Limits
Diagram-as-code is not universal; using it where it weakens costs more than it saves:
- Layout not fully controllable: you can set direction (e.g. top-down) and grouping, but rarely force "this box exactly 20px left of that one." Pixel placement → manual canvas.
- Large graphs degrade: hundreds or thousands of nodes/edges can produce many crossings or long edges; readability drops—often split into subgraphs.
- Limited styling: vs. freeform canvas, weaker expression for color, icons, arbitrary shapes—not ideal for high-design infographics.
- DSL learning and debugging: syntax errors, unquoted special characters (especially CJK labels) cause parse failures; error messages can be opaque.
- Render drift across versions: layout upgrades change positions—bad for archives requiring pixel-identical diagrams.
Whether a diagram fits diagram-as-code depends on structure clarity, explicit relationships, and need for version control: clear structure, diff-friendly, evolving with code/docs → text generation wins; freeform layout and strong visual design → manual canvas.
Summary
Diagram-as-code is a three-stage pipeline—declare structure, algorithmic layout, automatic render—handing coordinate decisions from humans to layout engines. You gain plain-text version control and co-evolution with docs/code; you pay with incomplete layout control, large-graph degradation, and possible drift across versions. Flowcharts, sequence diagrams, and ER diagrams are its home turf; pixel-precise and high-design work still belongs to manual drawing tools.