Sketch Infographic · Hand-drawn Diagrams from Code
Presentation diagrams shouldn't force a choice between pretty-but-uneditable and editable-but-dry. sketch-infographic is an Agent Skill that generates whiteboard-style SVGs you can tweak, version in Git, and extend with custom shapes.
A False Choice
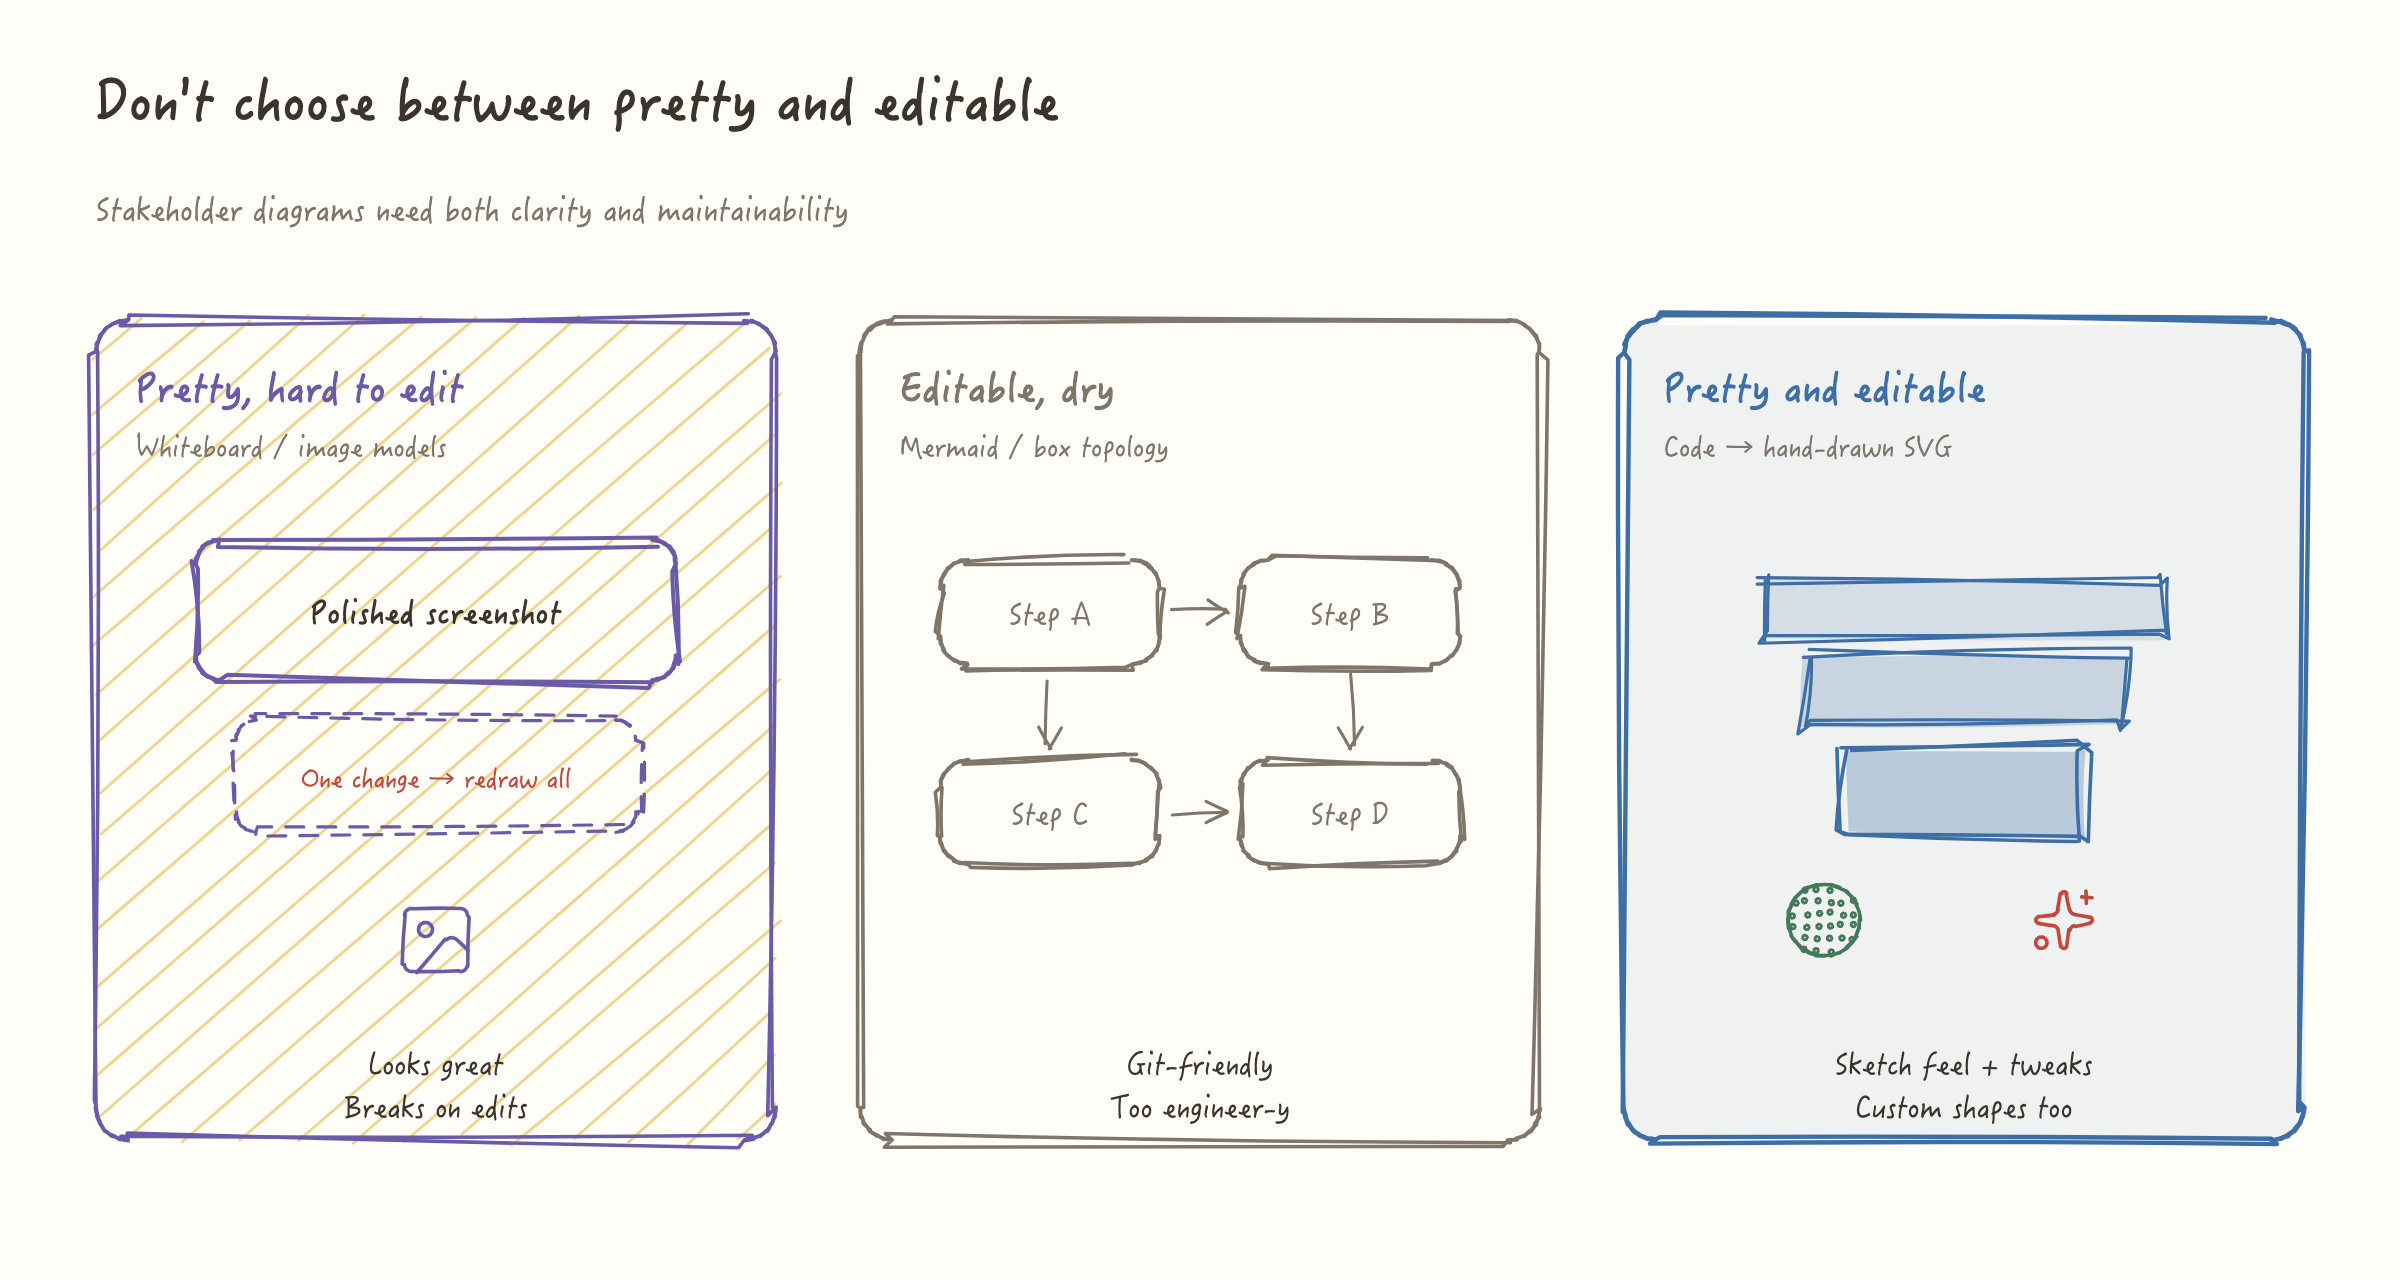
Pretty, hard to edit
Whiteboard tools and image models look great on v1 — then one change often means redrawing everything, with weak custom business glyphs.
Editable, dry
Mermaid is versionable and doc-friendly, but visually sparse — fine for engineers, weak for presentations or non-technical audiences.
A Third Path
Presentation diagrams shouldn't force pretty-but-uneditable vs editable-but-dry. Hand-drawn look, code maintainability, AI scaffolding, and local tweaks can coexist.
What You Actually Need
Not a topology wall
Whiteboard sketch style that non-technical colleagues can grasp at a glance.
Tweak without redraw
Move labels and nodes by editing a few coordinates — local re-render, no token burn.
Draw what it looks like
Packages, people, layered morphs — not just Box1 → Box2.
Key Features
Hand-drawn SVG
Whiteboard sketch look for talks, teaching, and cross-functional communication.
Code you can maintain
Diagrams are JavaScript — tweakable, diffable, and Git-friendly.
Custom shapes
Circles, stacks, paths, svgGlyph; Lucide built-in, or let AI draw business objects.
AI skeleton, local iterate
AI ships v1; daily tweaks re-render locally — no repeated image-model calls.
Workflow
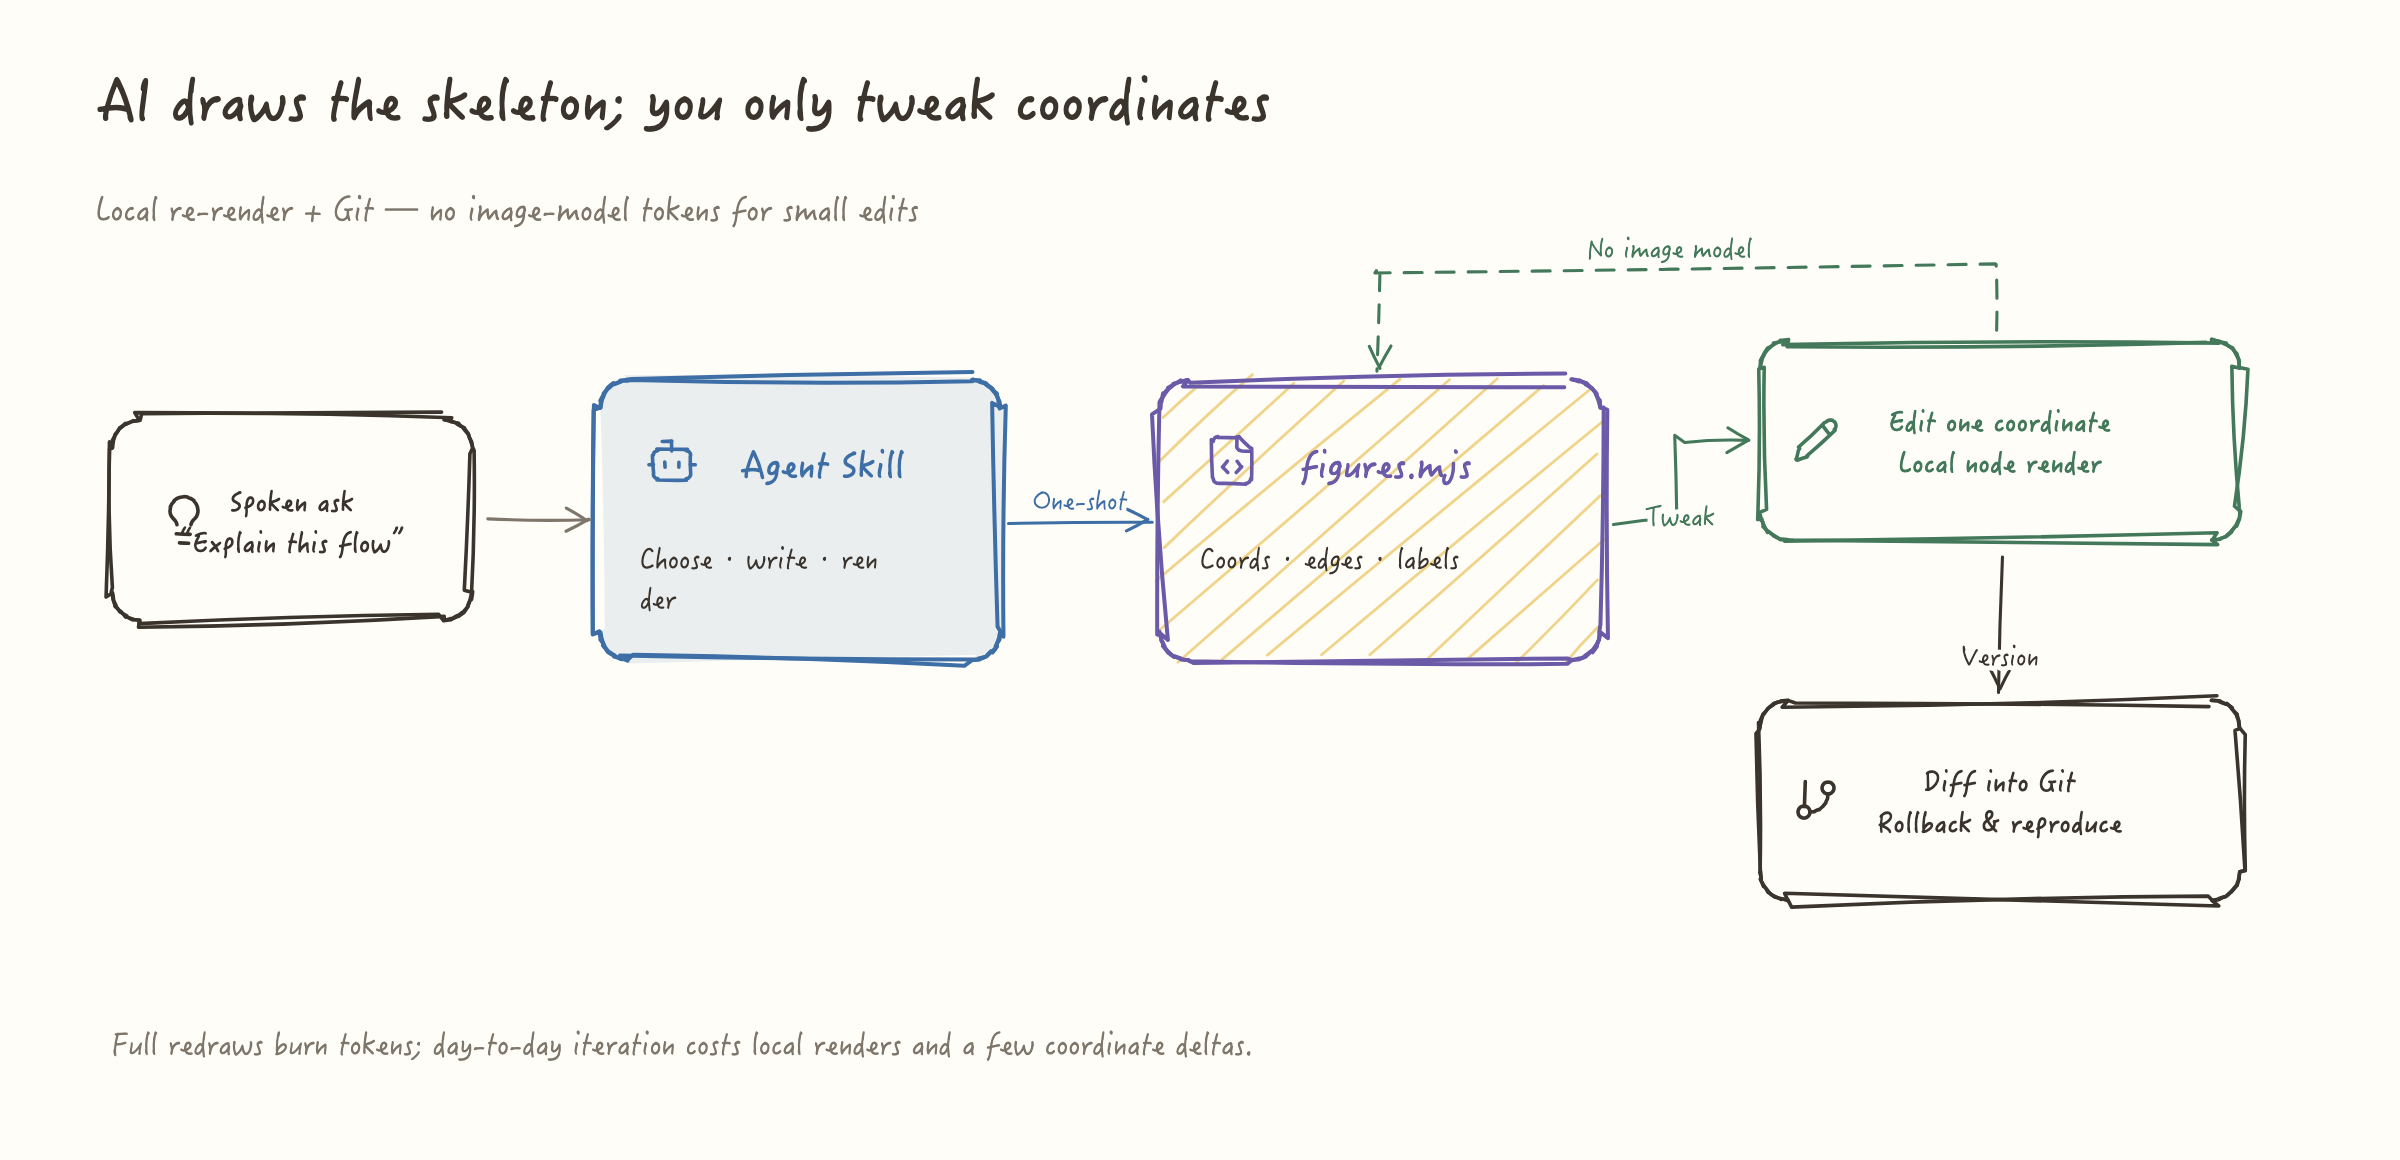
Describe the ask
Tell the Agent to explain a flow or draw an architecture diagram.
Generate the script
The Agent writes figures.mjs and renders a hand-drawn SVG locally.
Tweak locally
Next round: edit coordinates, colors, labels — then node render.mjs.
Commit to Git
Diffs are reviewable and reproducible. Day-to-day cost is coordinates, not tokens.
Why "what it looks like" matters
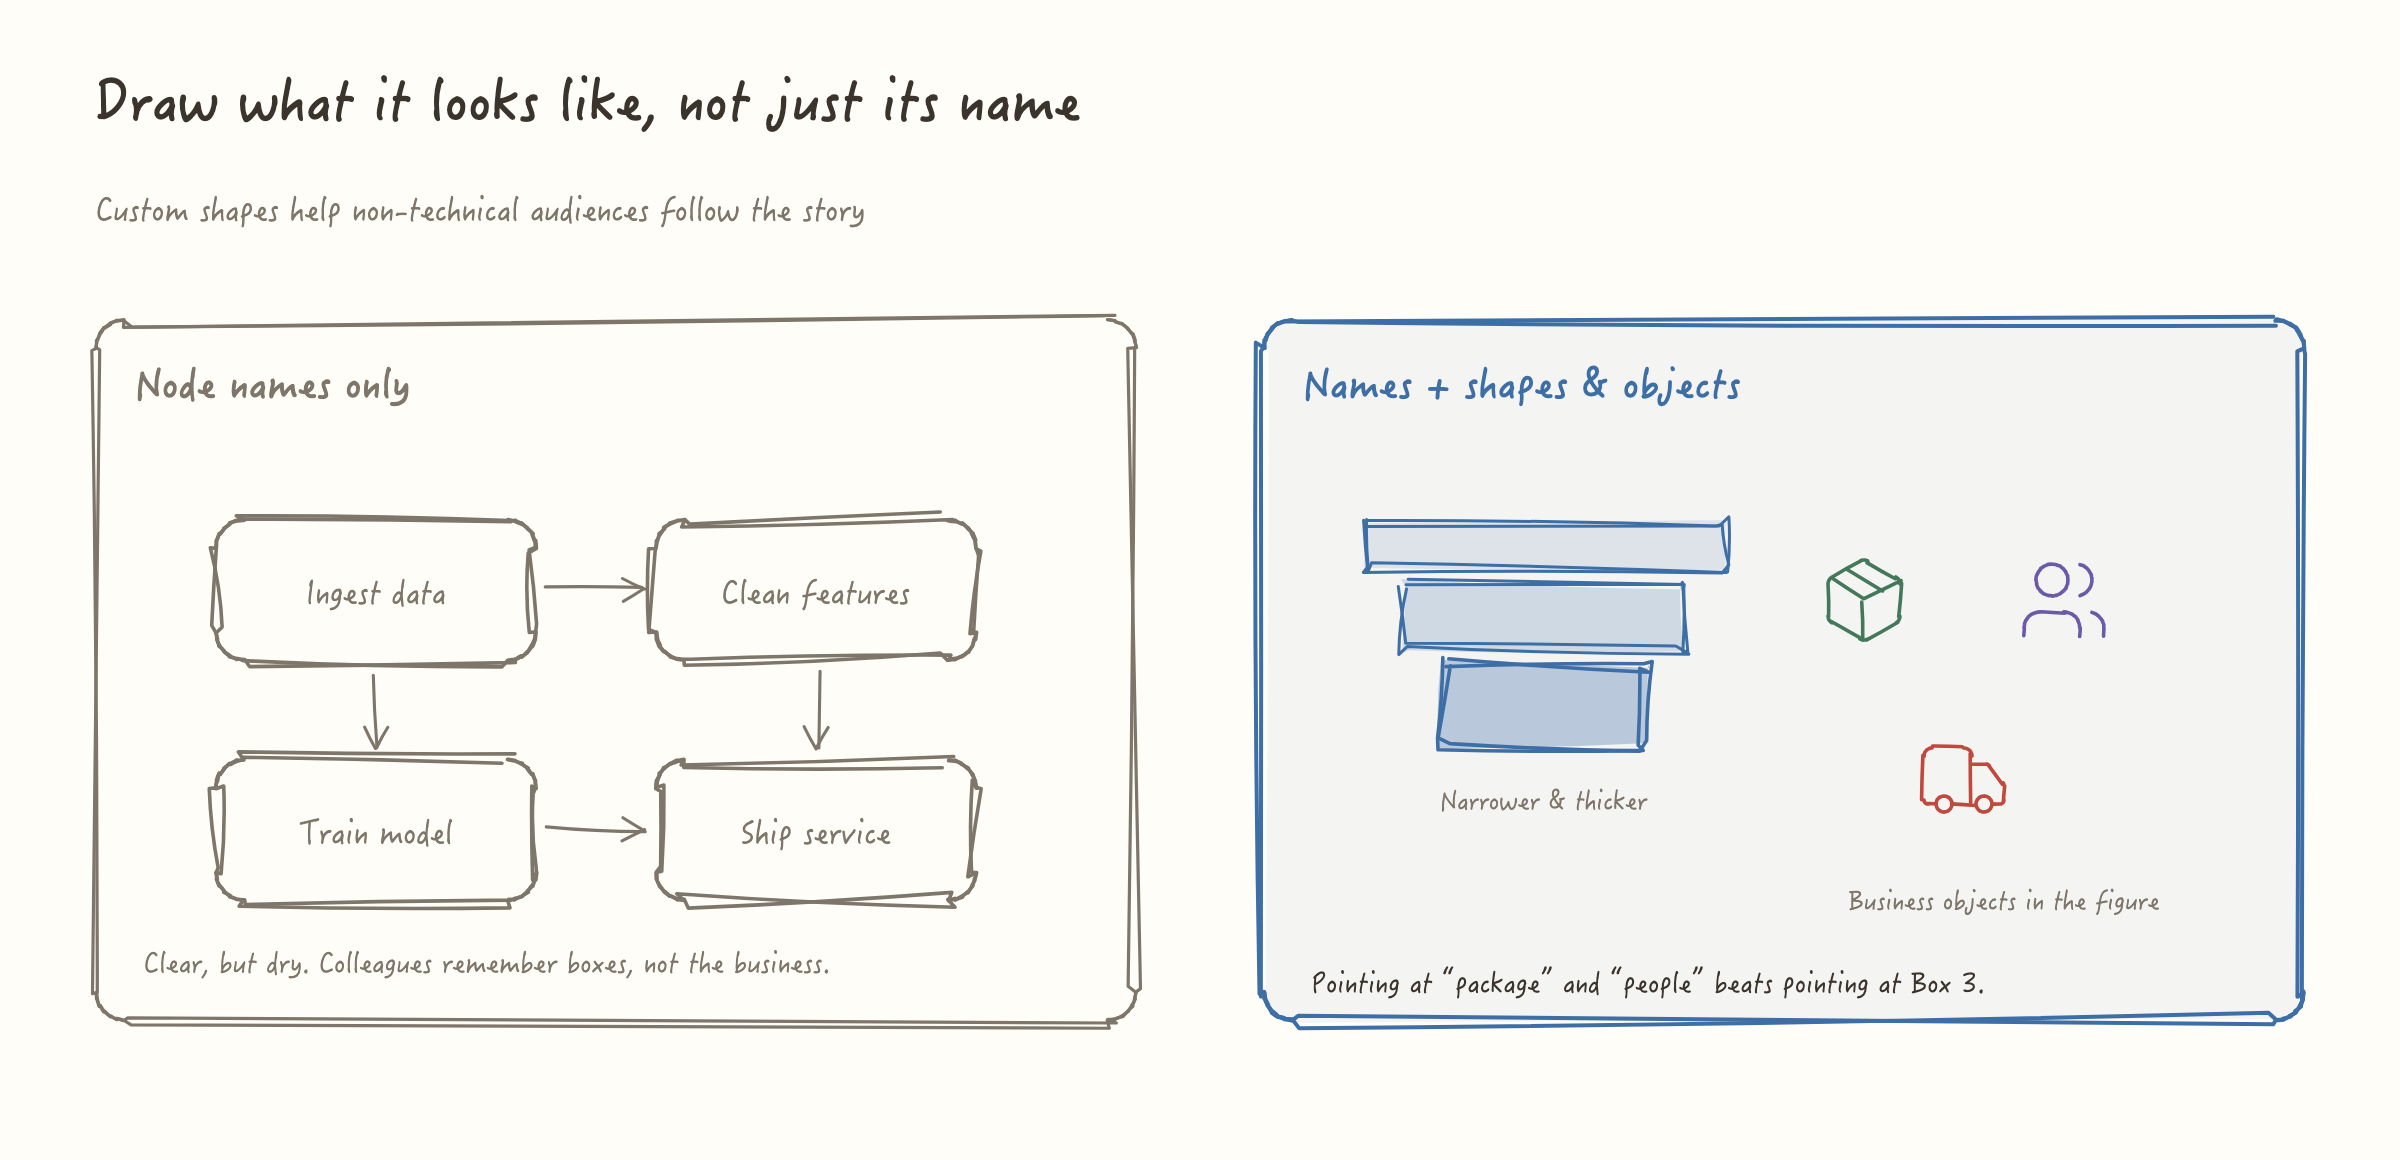
Non-technical audiences remember "package" and "person", not "Step C". Use shapes for morphs; use boxes when the story is dependencies.
Fit / Not a fit
Great for
- Research frameworks & teaching
- Service topology & business paths
- Architecture reviews & stakeholder talks
- Structure diagrams you'll revise often
Not ideal for
- Large-scale data exploration / interactive charts
- Photo-realistic illustration or covers
- Teams standardized on minimal Mermaid flows
Trigger Phrases
"Draw an architecture diagram for …"
"Explain this flow with a sketch"
"Make a hand-drawn infographic"
"Use sketch-infographic to draw …"
Installation
$npx skills add morvanzhou/sketch-infographicRun this command in your terminal, or simply ask your AI assistant to execute it.
Tell us what you want, AI will help you realize it
This site is built together with its users — your suggestion will be turned into a real feature by AI. See what everyone's hoping for, vote, follow, and help make it happen.
Frequently Asked Questions
- Mermaid shines for minimal engineering flows. sketch-infographic outputs whiteboard-style SVG — topology boxes when needed, plus circles, stacks, and custom glyphs for "what it looks like", with code you can tweak and commit.